Environmental Footprint
Environmental Footprint

When it comes to bottled water’s environmental footprint, we have a strong and positive story to tell.
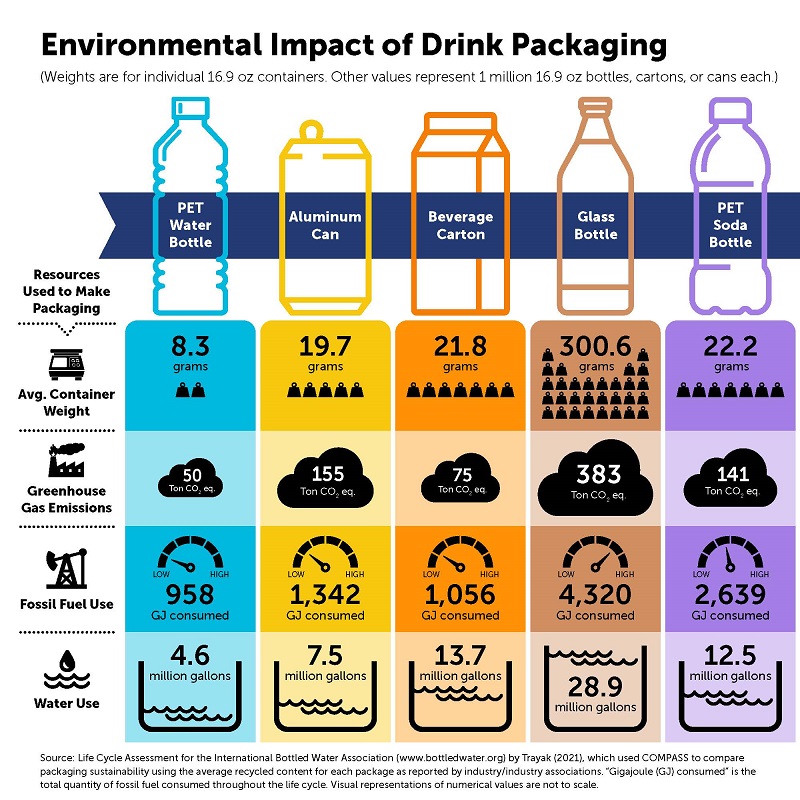
A 2021 life cycle assessment (LCA) conducted by the product sustainability consulting firm Trayak compares the impact on the environment for the following 16.9 oz packaging options: PET water bottle, aluminum can, beverage carton, and glass bottle. The study also included an assessment of the PET soda bottle. The infographic above provides an overview of the study’s results. (Read the Executive Summary.)
Trayak’s conclusion: PET bottled water containers have the smallest environmental impact.
The reason: PET bottled water containers weigh less, and lower material usage means less impact from material extraction and manufacturing. (And remembering to recycle will lower that impact even more.)
Lowering PET bottled water containers’ impact even more is the fact that PET bottled water containers are 100 percent recyclable and accepted by all recycling facilities across the United States. However, the same cannot be said of all the containers in the infographic. While aluminum cans are also widely accepted by recycling facilities, most recyclers do not accept paperboard cartons, and few now accept glass. To find out what items are accepted by your local recycling facility, you’ll need to contact it directly.
According to the National Association for PET Container Resources (NAPCOR), the recycling rate for PET bottled water containers stands at 33 percent, which is higher than the recycling rate for other PET bottles, which is 29 percent. When you do the math, it turns out that of all the plastics produced in the United States, PET plastic bottled water packaging makes up only 0.92 percent – less than 1 percent. Moreover, plastic bottled water containers make up only one-third of 1 percent of the U.S. waste stream, according to the U.S. Environmental Protection Agency.
Overall environmental impact
A report from the American Chemistry Council (ACC) – Life Cycle Impacts of Plastic Packaging Compared to Substitutes in the United States and Canada – looked at the overall impact of plastics on the environment compared to other materials to answer the following question: If we weren’t using plastic for the container, what would we be using instead, and what would be the impact of those alternatives? ACC’s report concluded that, when comparing materials throughout the entire life cycle of a package, plastics leave a much smaller environmental footprint than alternatives, such as glass, aluminum cans, and paperboard cartons. Perhaps the most significant finding from the ACC report is that alternatives to plastic beverage containers would produce about 60 percent more greenhouse gas emissions.
To review a comprehensive comparison of packaging materials used to produce beverage containers and their environmental footprint, CLICK HERE.
Life cycle inventory study
IBWA commissioned a Life Cycle Inventory (LCI) study to determine the environmental footprint of the United States bottled water industry. The results indicate that bottled water has a very small environmental footprint. Key findings of this study show that water is the least environmentally impactful beverage option and that bottled water is the most environmentally responsible packaged drink choice. The LCI study also found that:
- Tap water has the lightest footprint, followed by tap water consumed in reusable bottles (if used more than 10 times), and then bottled water.
- Sports drinks, enhanced waters, and soda produce nearly 50 percent more carbon dioxide emissions per serving than bottled water.
- Juice, beer, and milk produce nearly three times as many carbon dioxide emissions per serving than bottled water.
- Milk, coffee, beer, wine, and juice together comprise 28 percent of a consumer’s total beverage consumption but represent 58 percent of climate change impact.
IBWA members can download the executive summary of the LCI study by logging in to the Member Dashboard.
Water and energy use
Even with continuing growth and increased consumption, bottled water still has the smallest water and energy use footprint of any packaged beverage. Results from a 2018 Water and Energy Use Study, conducted by the Antea Group for IBWA, show that the amount of water and energy used to produce bottled water products in North America is less than all other types of packaged beverages. On average, only 1.39 liters of water (including the 1 liter of water consumed) and 0.21 mega joules of energy are used to produce 1 liter of finished bottled water.
Light-weighting
Bottled water companies have also reduced the environmental footprint of their plastic containers by continual light-weighting of PET bottled water plastic packaging, which has resulted in the average weight drop to 9.25 grams per 16.9 oz single-serve container. That is almost one-third less PET than the amount it takes to make soda and other drink containers, which need to be thicker due to carbonation and manufacturing processes and weigh, on average, 23.9 grams.
Between 2000 and 2014, the average weight of a 16.9 oz single-serve PET bottled water container reduced by 51 percent, according to the Beverage Marketing Corporation. This saved 6.2 billion pounds of PET resin during that time period.
Recycling
In addition to being made from the most environmentally friendly packaging material (i.e., plastic), bottled water containers are 100 percent recyclable – including the caps. Most 16.9 oz bottled water containers are made from polyethylene terephthalate (PET), which is the one of the most recycled plastics in the world. PET plastic can be recycled over and over because it is a polymer that is repairable, meaning you don’t have to worry about it losing its mechanical properties through the recycling process.
Bottled water is the most recognized and recycled PET plastic container in curbside recycling systems. In fact, bottled water containers make up approximately 55 percent (by count) of all PET plastic collected in curbside systems throughout the United States. (In comparison, plastic soda containers make up only 18 percent.) IBWA continues to support strong community recycling initiatives and recognizes that a continued focus on increased recycling is important for all. The recycling issue increases in importance as more and more states look to implement recycled content mandates.
rPET and rHDPE
For many years, bottled water companies have been increasing the use of recycled PET (rPET) and recycled HDPE (rHDPE) in their containers. Many bottled water companies have embraced using rPET packaging, offering their products in containers that are made of 50, 75, or even 100 percent rPET. But to keep that trend going, bottled water companies need to have a sufficient amount of rPET and rHDPE to use. Consumer access to—and participation in—convenient recycling programs help determine the supply of rPET and rHDPE. If more people recycle, then the availability of rPET and rHDPE will increase as well.
U.S. waste stream
According to figures derived from data by the U.S. Environmental Protection Agency, PET plastic bottled water containers account for less than 1/4 of 1 percent of the U.S. waste stream. Bottled water production accounts for less than 0.02 percent of the total groundwater withdrawn each year. Measured in tons of landfill space, PET plastic bottled water containers make up just 3.3 percent of all beverage containers that end up in landfills. Waste percentage numbers are much higher for the glass (66.7 percent), aluminum (7.9 percent), and plastic soft drink bottles (13.3 percent) that end up in landfills.


